
Week 1 RECAP
Price closed the Week at $64.8K after a REJECTION at $65.5K
Momentum kept price ABOVE the Daily SMA BUT it is now BELOW
The Weekly timeframe has broken back BELOW the $64K Fib Pivot
Price looks like it’s forming an inverse relationship to 2018 now
Levels that matter most
The 4H is starting to expand to the DOWNSIDE again

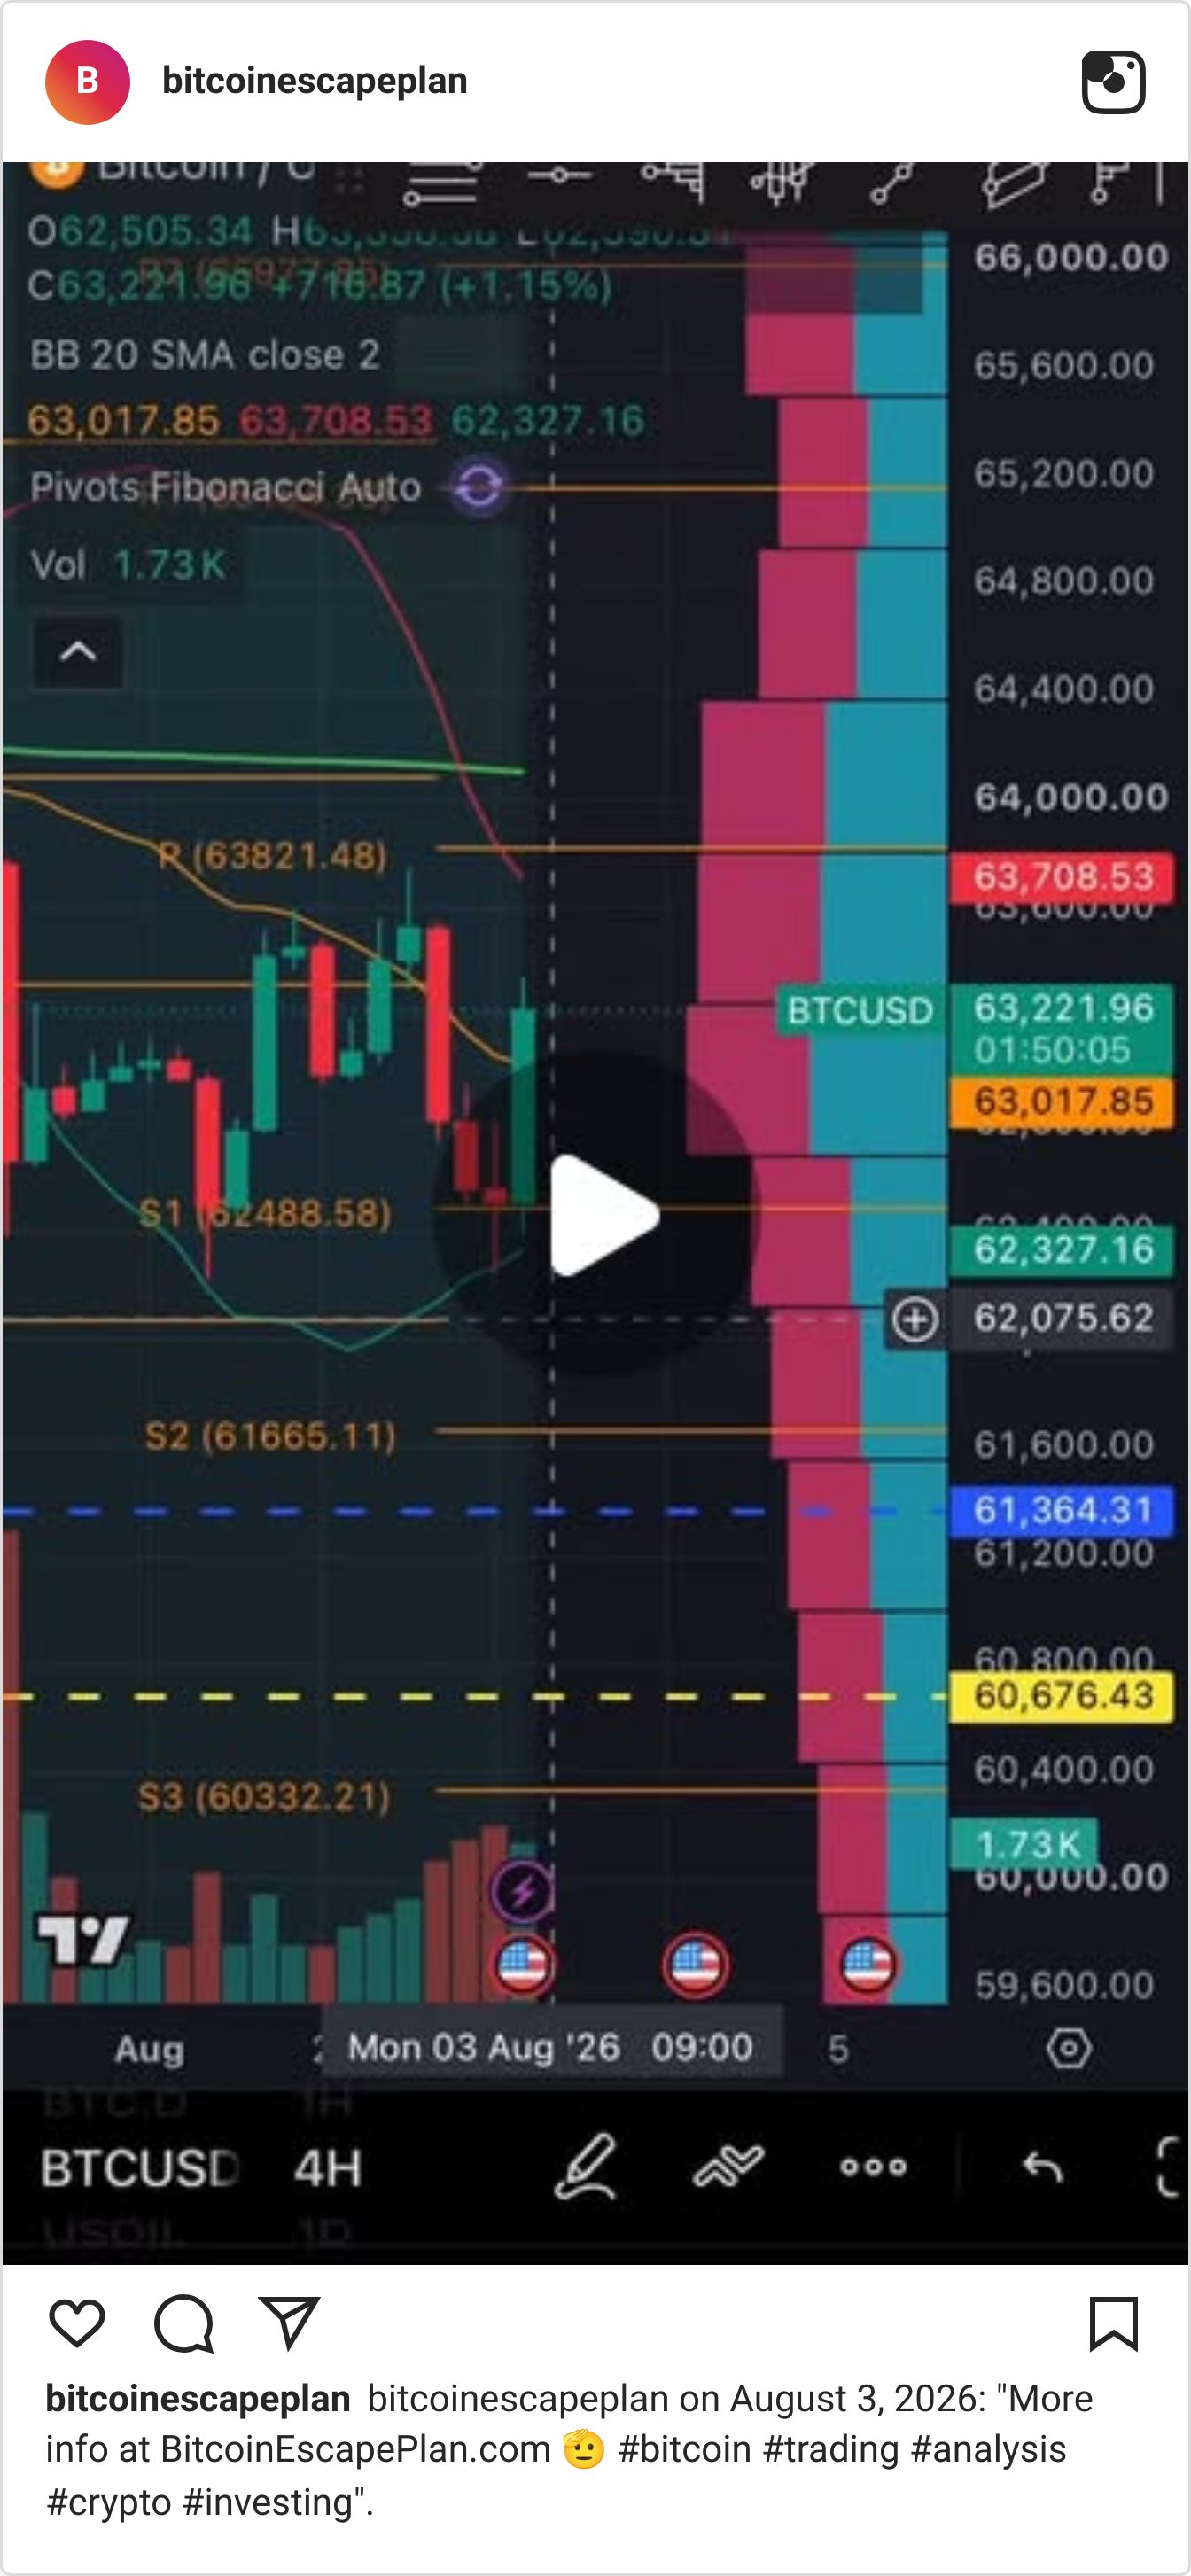
Right now on the 4H we’ve seen a steady UPTREND and a brief period of COMPRESSION that now appears to be breaking toward the DOWNSIDE. This has not yet invalidated the short term uptrend but it is worth paying attention to since we don’t have a useful fractal at the moment for historical context. That means we’re flying blind just using local targets and while that can still produce excellent results - it is less reliable than having the full picture. That means we need to pay very close attention to price REACTIONS around $64K.
$64K of course is one of (if not THE) most important levels on the chart as a higher timeframe Fib Pivot (and very close to the midpoint from the $126K ATH) and price will be drawn there in hopes of CONFIRMATION of trend. As of my writing this the price has tagged the Bottom Band of the Downtrend AVWAP as well and it’s now trying it’s hardest to close ABOVE it for this 4H candle. Structurally there IS decent SUPPORT at these levels and therefore a drop toward $62.5K will not be immediate - though it could be rather fast once we show WEAKNESS is CONFIRMED at that $64K level that I mentioned.
MY Perspective
I’m really glad I didn’t close my Short. This is why it’s important to be PATIENT with your trade setups rather than making decisions based on your EMOTIONS. I could just as easily be sitting in this amount of Loss (I was for a while) but am now back in healthy profits because I didn’t see the STRENGTH we needed to see on the Weekly close - and I got lucky. I of course have no control over what the price does I just tell the weather.
$62.5K and $62K was important SUPPORT about a week ago and I am expecting that to be a relevant level if $64K is found as RESISTANCE and $63.8K can’t hold either. But we’re entering into a time of the year where you may be better off taking Scalps than staying in Swings. I don’t think the trade I’m in now is very responsible. Now have I managed it well? Yes, I raised my Cost basis sufficient to now be in Profit instead of Loss. Could that just as easily flip against me again? Yes in this market it can.
I’m just taking it one day at a time right now. I’ll continue going over the local levels both on YouTube and the 4HR Break Room but for the most part I’m going to let this Short run and may have to send a Long earlier than expected. Very possible that it still results in a better Short.
The Daily timeframe really looks like APRIL to me now
The Daily has a few important factors we need to keep in context and then one not so obvious signal that for me confirms the reality of the trend now. I’ll talk about the shape of the pattern more on YouTube but essentially the Daily SMA has been ABOVE the Bottom Band of the Downtrend AVWAP and that may not be the case for much longer as it continues to trend down toward it. This would put short term DOWNSIDE pressure back on the price (though in April/May this did result in a violent snap to the UPSIDE after the pattern).
Meaning we could just be seeing a sweep LOWER that ultimately resolves in that move back toward $73.8K-$76.3K that I’ve been studying on YouTube. I’m still not convinced we see it yet but the signals are all there for us to watch closely. Obviously price breaking back BELOW the Daily SMA as violently as it has today is something we want to pay attention to. It has basically given up all the gains it had made since last Monday and it calls the UPTREND into question sufficient enough for us to consider that we may still be BEARISH.

This is why PATIENCE pays my friends. You do not want to keep flipping your position during chop - you want to decide what the trend tells you - and you’re either RIGHT or you’re WRONG. There’s nothing else to do it really.
MY Perspective
I AM biased toward this momentum carrying price LOWER given that cross on the Daily SMA and Bottom Band of the Downtrend AVWAP that is looming on the horizon. It may resolve to the upside BUT not before it carries the price sufficiently LOW enough to make profits on a Short. It really depends on WHERE the Daily candle close is today but if it’s anywhere BELOW $64K like it is now then I would imagine that carries the Daily SMA MUCH LOWER and I’ll cover that more on YouTube.
Daily Bollinger Bands are showing significant COMPRESSION so I would imagine we have CONFIRMATION of trend within the next few days and I’m remaining in my Short until probably closer to a $62K RETEST and then I will have to consider if it’s worth taking action on the UPSIDE. I will of course continue to keep you guys posted as I make that decision.
The Weekly is just telling the same story that it has been

For the past several weeks now there have been 3 Levels I keep repeating in almost every YouTube video. $64K. The Bottom Band of the Downtrend AVWAP. And $66.9K. We are now entering our 4th Week BELOW the $66.9K Point of Control and have now given up the other 2 Levels AGAIN after just barely RECLAIMING them last week. This is not strong indication of BULLISH pressure and really just seems like the market is grasping at straws to keep the price elevated while all the news is BEARISH besides the ETF inflow amounts.
I am still reserving my judgment until such a time that a useful fractal appears again within the historical context. The short term can continue to be flippant for a very long period of time and that will determine how much I’m willing to be exposed to leveraged positions during this period - though I will cover today on YouTube WHY I think the Perpetuals contracts are still your best bet for maintaining exposure to Bitcoin during these periods of UNCERTAINTY. And it’s never a bad time to DCA when we’re BELOW the Monthly/Weekly SMA.
MY Perspective
Bitcoin closed BELOW the open of last week’s candle and closed at $64.8K after multiple REJECTIONS at $65.5K. I had been talking about it in 4HR Break Room but ANY of the targets ABOVE $65K could have broken like tissue paper and $65.5K was the one that finally showed enough RESISTANCE for the price to return back home to $64K. Since it closed the Week ABOVE that - we could still see some real chop in giving up that level to the DOWNSIDE. But the longer we stay BELOW it the more we need to start trending toward the middle of the new range we’re in - being closer to $54K (which I don’t see happening in August).
The only other thing I’m considering really is that we’re in an INVERSE relationship to the August candle from 2018 - meaning then we saw downside the first 2 weeks and upside the next few weeks. Whereas we may have just seen our upside momentum and we’re either RETESTING once more to the upside or we are shortly about to enter that DOWNSIDE RETEST back toward $60K and potentially even $57K. Broadly speaking that WAS what I expected - so we’ll see what happens.
The Monthly is probably the most confusing one now

While the Monthly candle has CORRECTED itself on TradingView to the proper open and close - it is still unclear whether we carry this momentum HIGHER into a true paradigm shift or if we just have a sincere FAKEOUT on our hands. Either way that $62.8K level is very important for us to pay attention to since that would flip the month BEARISH and that’s ultimately what history would suggest for us to expect. As I always say on YouTube, typically we would expect to see between 3 and 4 Green Monthly candles in a Bear Market year and we’ve already seen 3 of them print - so there’s no guarantee of more.
It would be more surprising to me for August to close BULLISH than for it to simply close somewhere BELOW $62.8K. Originally I assumed it would carry into that price by the end of the month toward a top out around $64K but these recent price tags of $65.5K call that assessment into question a bit. I’ll keep analyzing the trend as it updates but broadly I still expect LOWER in August even if the trend ends up reversing toward the end of the month.
MY Perspective
I would expect August to be FLAT more than anything. But it will be flat BECAUSE it chopped to both sides of the trend - which is great for anyone Scalp trading and really stressful for anyone in Swings. I will have to take more trades in August than most of the other months of the year. But I’m comfortably up over 440% on these Perp trades even with the bit of Loss I’ve had in this range so far. Overall not that worried about it and just focused on maintaining exposure to the trend.
None of the news stories are BULLISH - you know I don’t care - but we can’t ignore a signal like that. It’s telling us very clearly that the downside pressure is not over yet and that’s why sometimes it’s okay to sit in Loss on a position because it may still reward you for a contrarian opinion. Overall I’ll be watching $62K closely now to see if price can bounce there.
If you can’t be PATIENT - you shouldn’t be TRADING. If you can’t TRADE then you should be INVESTING. Once you’ve invested enough you’ll be patient enough to start winning trades again.
Level Up YOUR Bitcoin Escape Plan!
Join my Membership for LIVE Bollinger Band Interpretation. |
Read my Book on Bitcoin Narratives for FREE here. |
Learn how to Leverage your Credit for BTC here. |