Week 3 RECAP
Price was REJECTED at $76K just shy of the $76.2K target last week
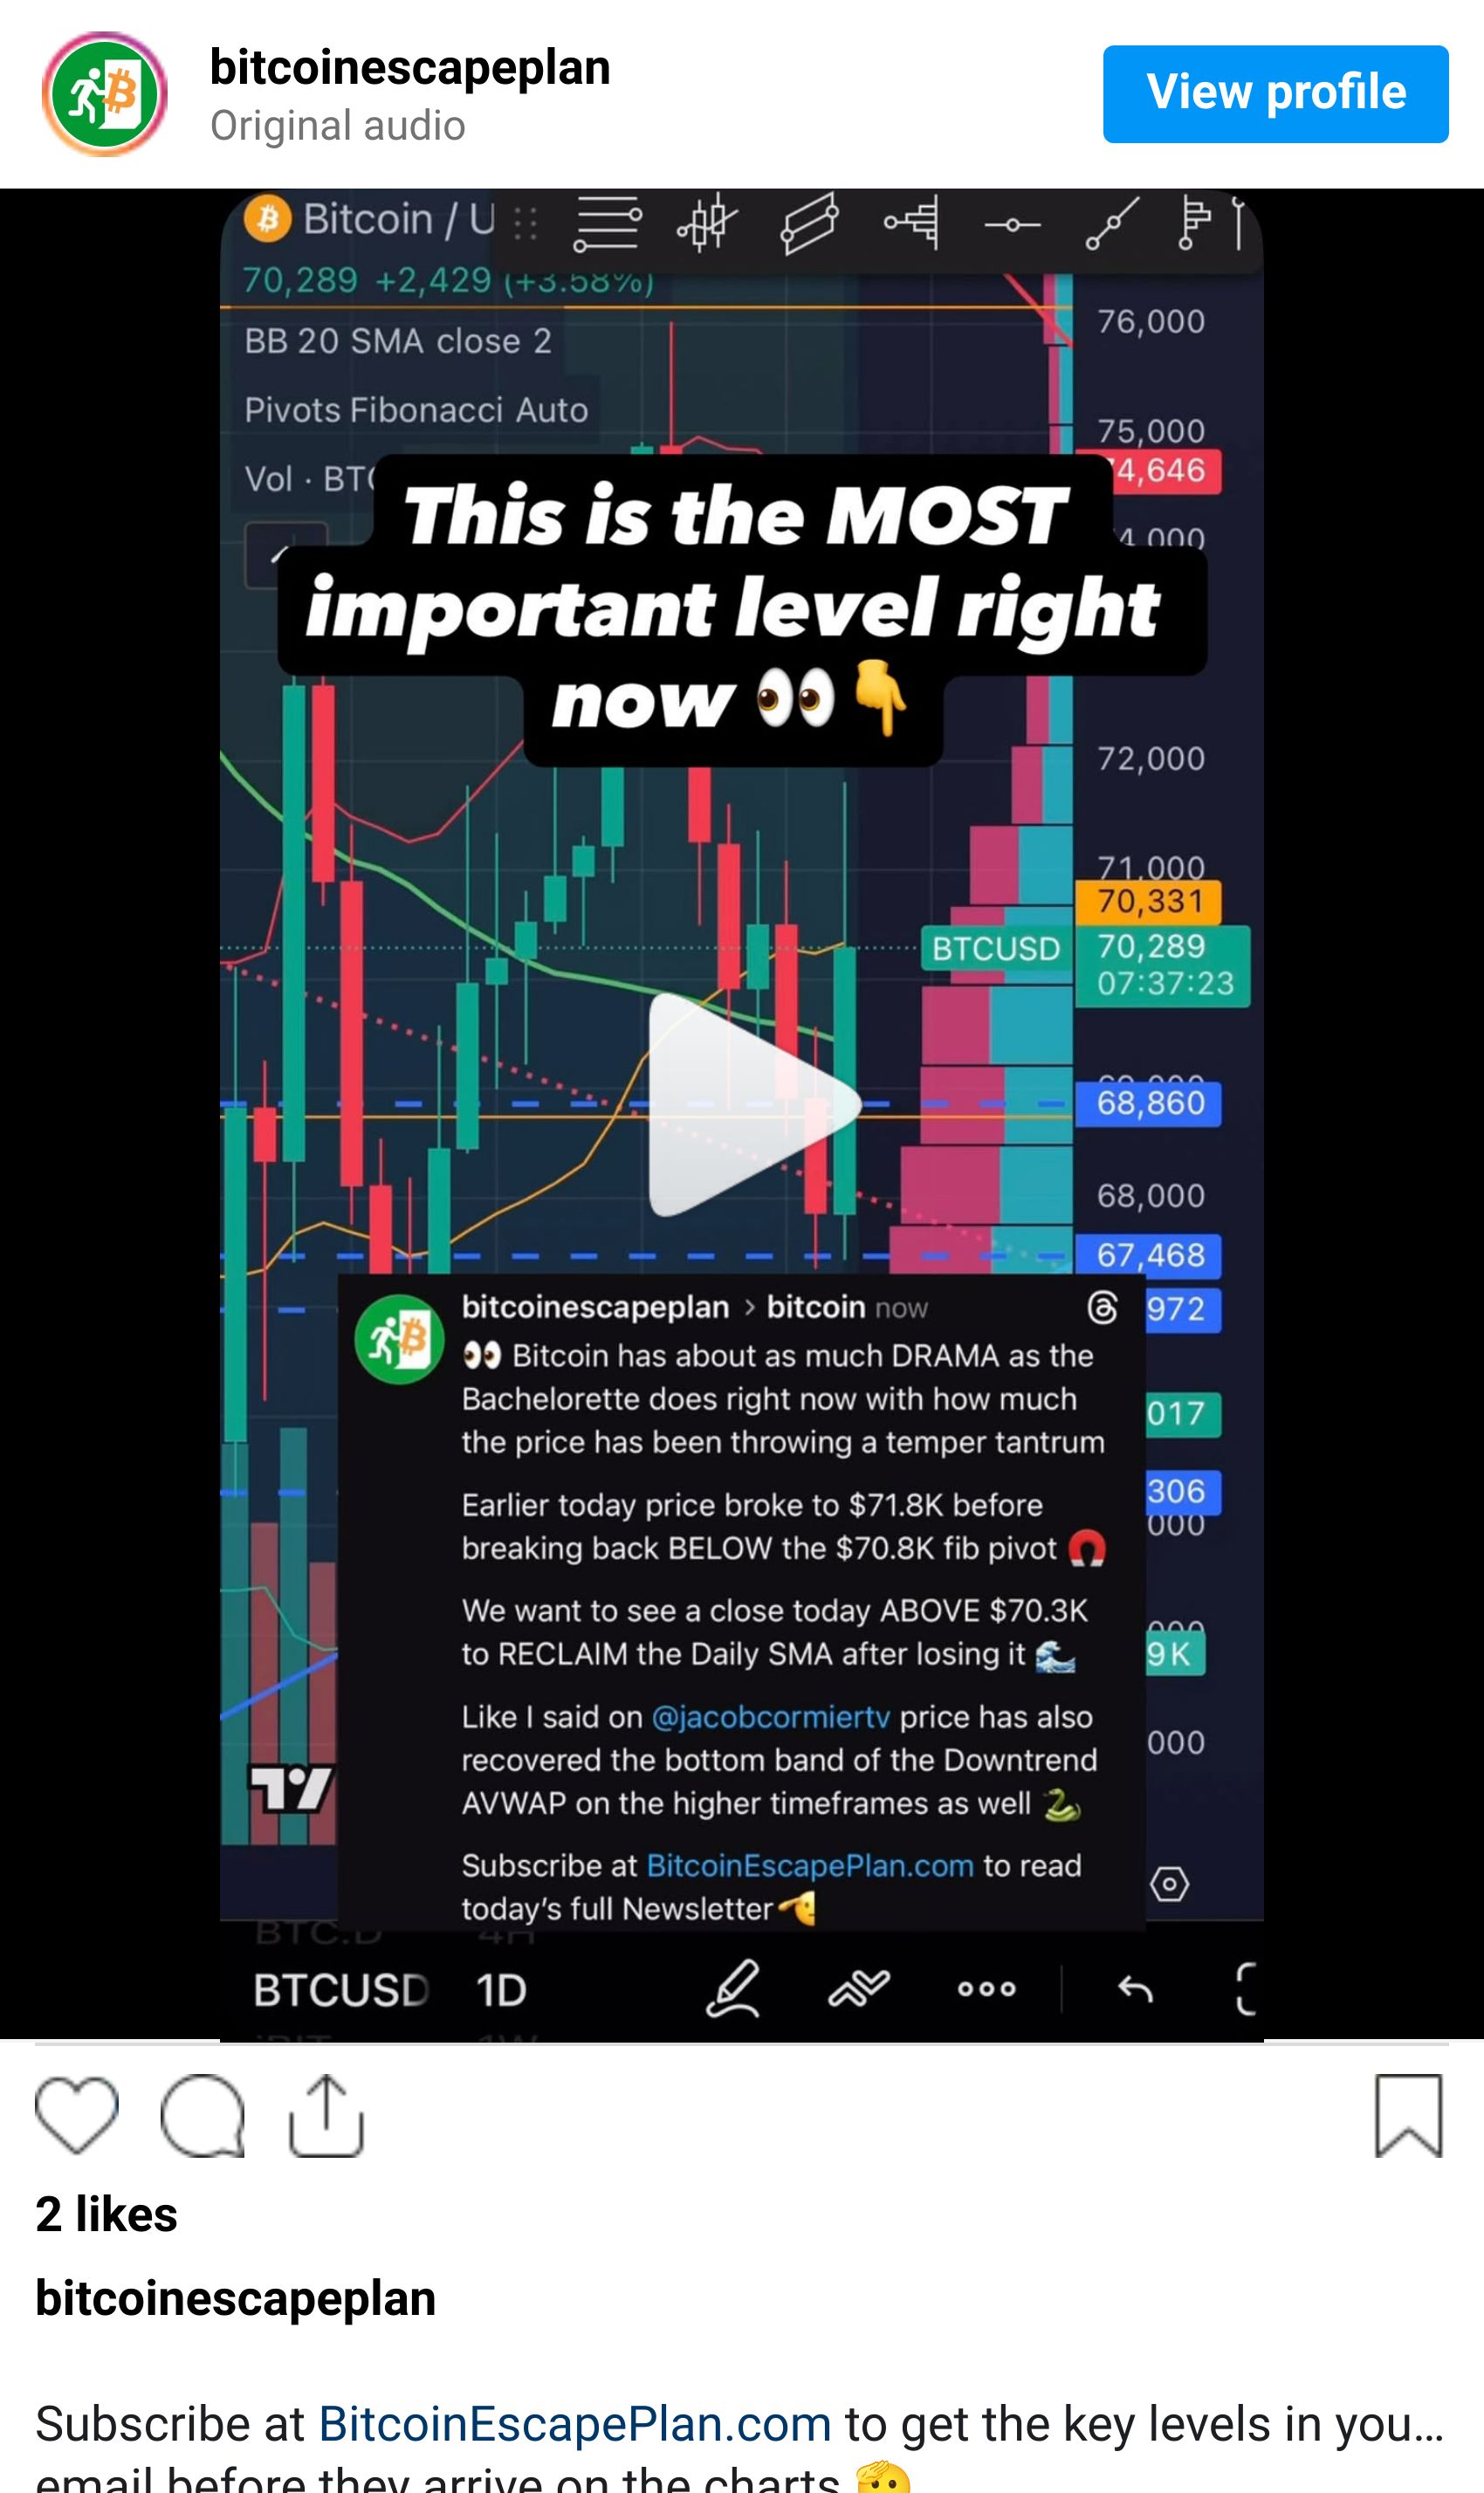
Chopped back BELOW Downtrend AVWAP bottom band - now ABOVE
Anchored Volume Profile shows buyers are stepping in at these prices
Price closed Week BELOW 50% mark of the $76.2K to $64K range
Levels that matter most
4H timeframe has some interesting momentum clues

The best sign of HOPE right now on the 4H timeframe is the 4H SMA curving before interacting with the bottom band of the Downtrend AVWAP. That will allow pressure to build for more upside momentum with some SUPPORT. There is nothing preventing the price from RETESTING and breaking BELOW that level - but it managed to close back ABOVE the bottom bands for now.
Price hasn’t quite reached the point of INVALIDATION for this rally so the FAILURE at $76K shouldn’t be regarded as the final attempt just yet. The full extent of this move may be pulled out into April as I’ve mentioned in many YouTube videos and Newsletters before now. Same as last week we want the price to remain consistently ABOVE $70.2K for more upside momentum.
MY Perspective
The price DID interact with the red dotted trendline I have drawn there from the February LOWER HIGHS. And it does make it slightly more likely now that price will attempt to RETEST that blue trendline below that one. On the higher timeframes it’s dropped a bit closer but in general time is running before we see a major confluence event with Downtrend from $126K and the uptrend from $60K - and we’ll see which momentum wins.
I actually think it’s great that the 4H SMA curved right before hitting the bottom band of the Downtrend AVWAP. That really gives the price a chance to breathe at that level and it needs it right now if there’s any hope for upward momentum during the increasing global uncertainty.
It does look more and more like we’re going to FAIL closer to $80K than $86K before liquidity starts to run dry but it looks like we’ll know by the middle of April according to the trendlines. So between now and then we just have to pay attention to how close it comes to either trendline. This will give us what we need to know about the future price trajectory.
Daily SMA RECOVERY could make all the difference now
The Daily was looking great at the beginning of last week and then rapidly fell off a cliff until just now RECLAIMING the Daily SMA and giving some renewed hope that this rally can continue. Like on the 4H timeframe the price has broken back ABOVE the bottom band of the Downtrend AVWAP meaning it will continue to be pulled toward the middle band depending on RESISTANCE.
That middle band is currently at $84.6K and that falls in alignment with my expectation that we won’t get all the way to $86K (without a massive wave of liquidity that likely is not coming at this stage of the cycle). The likelihood that we react favorably to that middle band instead of getting REJECTED by it is very low. Not zero. But very low. This means we need to watch momentum.

If the Daily SMA can continue to RISE and put more and more SUPPORT between it and the bottom band of the Downtrend AVWAP then the possibility remains for the price to keep building as long as the heavy buyers at $86K and higher from last year don’t start to sell off. And that’s the biggest IF there is.
MY Perspective
The Anchored Volume Profile is exceptionally THIN between about $72K and $86K - which means there are no human beings with emotions tied to Bitcoin being at that price. In a BULL market that can a positive thing - in a BEAR market it is more likely a neutral and therefore negative thing. The higher the price climbs the more we need people with a cost basis of HIGHER than $86K to not panic and cut their losses rather than hold on.
You can’t really blame people for making that decision - it is logical when you’re thinking in dollars. But if you’re reading this then you’re thinking in Satoshis - which means you aren’t looking for excuses to SELL your Bitcoin - you’re looking for the best opportunities to BUY more of it. And those opportunities are coming very soon if momentum breaks in April.
Bitcoin closed last week at $67.8K
Can the Weekly timeframe regain its momentum?

The Weekly timeframe is really where everything is about to be decided. The more weekly closes we get BELOW about $70.3K - the more likely that price will continue to drop toward $64K. If price can consistently close ABOVE $70.3K then eventually one of the momentum waves will break through $76.2K.
The real question is what happens AFTER the price breaks $76.2K? With the Weekly SMA now dropping as LOW as $80.7K it’s really not going to function as much of SUPPORT whenever price does interact with it - and by the time it does it will probably be even LOWER. Historically speaking we would expect to see another FAILURE to hold ABOVE the Weekly SMA between now and April.
MY Perspective
I’ve been very clear in all analysis content since December that I believe the price is still headed LOWER. Any upside momentum right now I believe is just a Relief Rally before CAPITULATION and downside momentum - that’s how you know it’s really a BEAR market. When all of the IBIT holders are ALSO in LOSS - that’s when the BEAR market is OVER.
If we don’t see prices break BELOW those levels (BELOW $44K) then it will reduce some of the volatility we would otherwise experience to the upside - meaning another cycle of getting less than the highs we hoped for. Sometimes the added pain of most holders being in loss is what builds their convinction to stay in the markets long term - and that’s where the real gains are made with Bitcoin. You must be very patient.
The Monthly is stuck between a rock and a hard place

It’s pretty much the same story for the Monthly in terms of needing to close ABOVE $70.3K to remain somewhat BULLISH. However there’s much less historical precedent for a RETEST of the Monthly SMA over the Weekly here. Meaning it’s very likely that the price CANNOT rise HIGHER than $90K now. This will persist until that Monthly SMA starts to drop - which will take months.
Meaning I stand by what I said previously that I don’t believe prices will rise ABOVE $97.9K for the rest of the year and we should instead expect a RETEST of $64K and LOWER once we have CONFIRMATION of SUPPORT/RESISTANCE at the former fib pivot of $80K. With so many higher timeframe targets converging in April it’s going to be a very important few weeks.
MY Perspective
Rich people sell things to pay for taxes - so it makes sense that sometimes the price runs up a bit right before those taxes are due. It’s pretty common for there to be a sell off around April 15th - last year this was a local bottom - this year it’s more likely a local TOP. I would still expect us to have one more local TOP in July but I think it will be LOWER.
Meaning however HIGH the price rises between now and April 20th is probably the best it’s going to be for the rest of the year. There’s always a possibility the drop to the bottom is violent and happens all at once - but it’s more likely that it will drag on over the course of many months. Because that’s how the oligarchs continue to buy more of it over time.
Small sums of money move quickly and then not at all. Large sums of money move very slowly but never stop moving once they grow.
OTHER ASSETS
Gold has RETRACED and is fighting to close ABOVE its January LOWS
SPY has continued their RETRACEMENT and is BELOW October LOWS
ETH is in the same boat as Bitcoin despite the news of multiple coins being added as commodities - it is not yet time for Altseason